

I run many of my SEO and AI-visibility analyses through MCP. I found this extremely intuitive and powerful. Instead of exporting CSV from Search Console, pulling a separate crawl out of Screaming Frog, and checking Peec AI in another tab, I ask one question and pull answers from all three in the same conversation.
MCP (Model Context Protocol) makes this possible. It plugs an AI model right into your data, so it can pull answers for you, without any coding or technical know-how.
Think of it as managing a data-analyst colleague who has direct access to all your tools and never gets tired of your follow-up questions. You don't need to know how they query the data - you just need to know what to ask.
It's not a perfect solution, and I'll flag where it falls short as we go. But for anyone who's spent hours stitching reports together, it's a meaningful change.
I'll walk you through working examples and sample prompts for three setups:
BigQuery MCP: Google Search Console data (traffic from traditional Google search)
Peec AI: AI search visibility data
Screaming Frog MCP: Technical SEO and crawl data
This guide gives you workflows you can drop straight into your week, not just prompts to copy.
How does MCP work?
There are three pieces to what makes MCP work: your data source, the MCP server “translating” it, and the AI client you type into. The client you choose dictates how you connect to MCP.
For this guide, you use Claude Desktop or an AI code editor like Cursor.
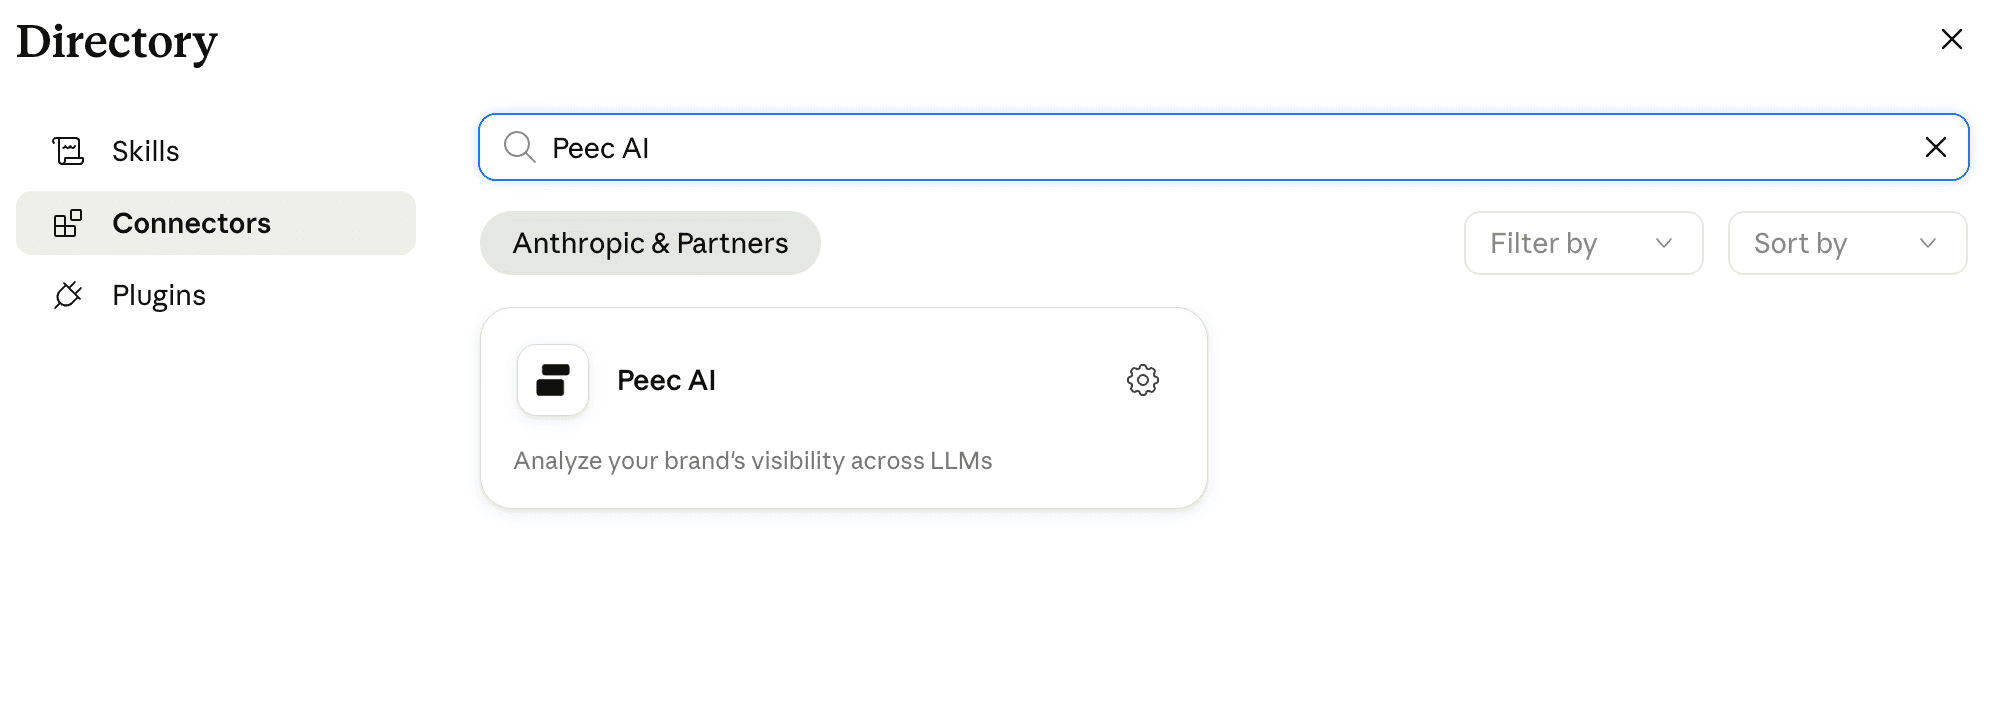
For cloud data and official partners of Claude (Peec AI and BigQuery): You can use the native "Connectors" menu directly in your Claude account settings online or inside Claude Desktop.
For local apps (Screaming Frog): You must use the Claude Desktop app, as web-based applications cannot access programs running locally on your computer.
When you connect an MCP server, the model asks it "what can you do?" and returns a list of available actions: run a query, pull a report, fetch a URL. From then on, you just ask a question in plain language, and the model picks the right action, calls it, reads the result, and answers you. That's really all there is to it. The MCP server does the translating, so you don't have to know the API or write the SQL. You only need to know what you want and express it in natural language.
How to install MCP
There's no single install tutorial that covers everything, because the steps depend on the platform. The good news is that none of them are hard. Here's how to set up each one I mention in this guide:
Peec AI is the easiest. Open the connector list in Claude and select the official Peec AI connector. That's it.
BigQuery takes a little more. You create OAuth keys and paste them into the connection settings. I just asked Gemini to walk me through it step by step and I was connected and querying within five minutes.
Screaming Frog ships an official package you download and add to Claude. (The setup guide for Screaming Frog is available here)
Other MCPs vary. Some, like DataForSEO, need a couple of extra modules installed, but it's mostly copy-pasting commands, not real configuration.
Note: if you want to make an MCP available to everyone in your organization rather than just your own machine, you can deploy it to Cloudflare. That's beyond the scope of this guide, but it's worth knowing this option exists once you've outgrown the solo setup.
Don't worry about the variations because we'll cover each one as it comes up.
Getting SEO data: Google Search Console via BigQuery MCP
There's no official MCP connector for Google Search Console, but you don't really need one. There are two workarounds, and the second is arguably better than a native connector would've been.
The first option is an unofficial GSC MCP. The second, the one I use, is to pipe your Search Console data into BigQuery and connect through the official BigQuery MCP. BigQuery's connector is maintained by Google, it's more reliable than anything unofficial, and once your GSC data lives in BigQuery you can run much deeper analysis than the Search Console UI or Search Console API ever allows.
Once it's connected, you can start asking questions straight away. You don’t need to build any dashboards first.
To get started, you can ask things like:
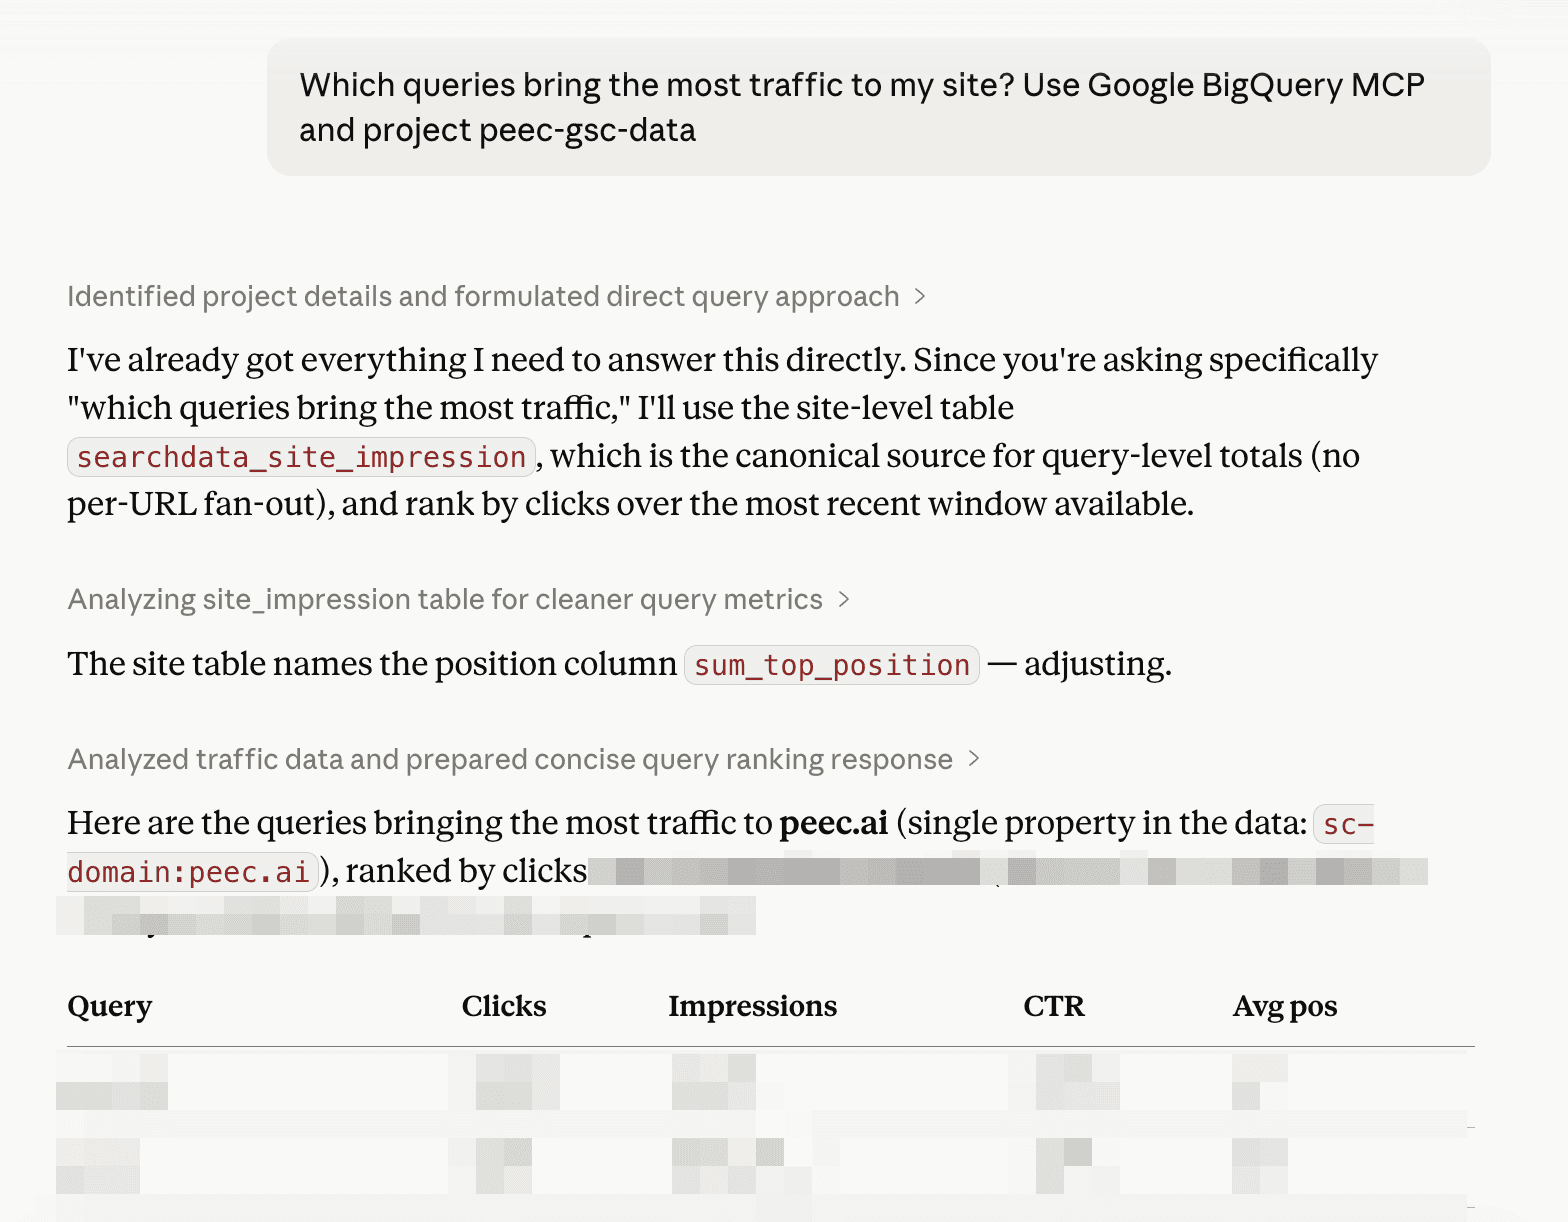
Which queries bring the most traffic to my site?
Which URLs have the lowest CTR despite high impressions?
Which countries send me the most traffic?
Did I get more traffic this week than last?
What share of my organic traffic is for branded terms, and did that change vs. the previous period?
Which pages rank well but barely get clicks?
From there you just keep going with follow-ups, digging deeper as you go.
For the heavier lifts, I've put together a couple of prompts that do most of the thinking for you. The first one breaks your Search Console traffic down by query intent. The second diagnoses week-over-week traffic drops: what fell, where, and why.
Prompt 1: Query analysis by intent
Using the searchdata_site_impression table in [your table in Google Big Query], analyze the queries driving traffic to [your website] over the most recent 90 days available.
Categorize queries by intent. First split branded vs. non-branded. Treat misspellings/phonetic variants of the brand ([list a few variations of your brand]) as branded. Then break each group into sub-categories (e.g. branded → navigational, pricing, careers/company, product/technical, comparison). For each category give distinct query count, clicks, impressions, and CTR, and call out where high impressions aren't converting to clicks.
Top countries by traffic. Rank by clicks with impressions and CTR alongside, and flag any country where impressions are high but CTR is low.
Exclude anonymized-query rows from the query analysis. State the exact date range and total clicks/impressions you're working from. Use SQL aggregation for the categorization rather than eyeballing, and end with the 2–3 most actionable findings.
Prompt 2: Analyze traffic drops in Google Search Console MCP
Analyze week-over-week traffic changes for [name of website] using the searchconsole dataset in [your table in Google Big Query]. Compare the most recent 7 days of available data against the 7 days immediately before it. First find the max data_date in the table and state both date windows explicitly.
Frame the aggregate first. Before any breakdown, report total clicks and total impressions for each window side by side. Clicks and impressions can move in opposite directions. Explicitly say whether this is a clicks drop, an impressions drop, or both, so the rest of the analysis is read correctly.
1. Topic-level changes (searchdata_site_impression). Categorize queries by intent. First split branded vs. non-branded. Treat misspellings/phonetic variants of the brand ([list a few variations of your brand]) as branded. Then break each group into sub-categories (e.g. branded → navigational, pricing, careers/company, product/technical, comparison).
For each category show clicks and impressions in both windows and the delta for each. Rank by clicks delta (biggest drops first) and call out which topics lost clicks vs. merely lost impressions.
2. URL-level click drops (searchdata_url_impression). Identify the URLs that lost the most clicks week-over-week. Categorize the URLs by page type (blog, docs, comparison, product/landing, app/login, agency, etc.) and show the net click delta per page type, plus the individual top-declining URLs with before/after numbers.
Exclude anonymized-query rows from the query analysis. Use SQL aggregation, not manual bucketing. Note that with a 7-day window single-digit deltas are likely noise. For this, distinguish material drops from noise, and end with the 2–3 most actionable findings (the specific pages/topics worth investigating, not the statistical noise).
Getting AI visibility data through Peec AI MCP
Two questions land on every SEO's desk now: are we showing up in AI answers, and are our competitors? Peec AI tracks your visibility across the engines people use regularly (ChatGPT, Perplexity, Gemini, Copilot, Grok, Google's AI Overviews) and lets you ask about it in plain language: how your visibility is trending, who's winning the prompts you care about, and which sources the models cite to build their answers.
Connected over Peec AI MCP, you can:
Check your brand's visibility across every major AI engine (ChatGPT, Perplexity, Gemini, Google AI Overviews, Claude, Copilot, Grok) and compare yourself to competitors on visibility, sentiment, share of voice, and position.
See which sources the models cite, and pull the actual content of any cited URL to read what the AI reads.
Spot trends by date, model, topic, or country, and get ranked next steps for where to improve.
Run ready-made workflows like the weekly pulse and engine scorecard, or have it manage your setup (prompts, topics, tracked brands).
Here are some sample prompts to get you started.
Prompt 1: Understand your general visibility in AI search
Using the Peec AI MCP, generate a Brand Visibility Overview for our brand over the last 30 days. Use the <project_name> project.
For each tracked model channel report:
Visibility %: fraction of AI responses that mention our brand
Sentiment: Peec AI's sentiment score, 0–100
Share of voice: Our share of total brand mentions on that channel
Average position: Average rank within the AI response when we appear (lower = better, 1 = mentioned first)
Then call out the 2 channels where we perform best and the 2 where we perform worst, ranked by visibility. Note if a different metric (sentiment, position) would change the ranking.
Prompt 2: Diagnose the visibility drops in AI search
Using Peec AI MCP compare the last 14 days vs. the 14 days before that. For every analysis below, look only at the top 20 sources/listicles by retrieval count.
By LLM (model channel): Which channels show a visibility increase and which a decrease? Give the previous %, current %, and the change in pp for each.
Category-wide check: Is the decline specific to our brand, or are competitors in the same category also dropping? Show the top competitors' visibility change side-by-side with ours so I can see whether this is a brand-specific issue or a category-wide shift.
Listicle inclusion and position. Pick the LLM with the biggest visibility drop. For its top 20 listicles by retrieval count:
What % include our brand now? What % included us in the previous period?
For listicles that include us, where do we rank inside the listicle? Fetch each listicle's content with
get_url_contentand parse our brand's position from the scraped markdown (look for numbered headings like "### 1.", "### 2." or ordered-list items, then find where our brand name or aliases appear). Do not infer position from thementioned_brand_idsarray inget_url_report- that field is alphabetical by brand ID, not source order. Report: % where we're ranked #1, % where we're in the top 3, and average position (current vs previous period). If a listicle's content hasn't been scraped yet (contentis null orcontent_updated_atis missing), skip it and note how many were skipped per period.
Repeat for any other channel with a meaningful drop. If both inclusion and position are stable on losing channels, flag that and point me to the next thing to check (e.g. own-domain retrievals, source-type structure shifts).
End with a one-paragraph synthesis: which channels drove the drop, whether it's brand-specific, and whether listicle inclusion or position is the cause or if something else needs investigating.
Prompt 3: Analyze the success story of competitors
Using our primary active project, generate a single Competitor Success Analysis report for the brand [name the competitor brand] over the last 90 days. Please execute the following tool-sequence step-by-step to gather the data:
Visibility Trend: Pull their daily visibility percentage and share of voice data. How has their overall presence changed over time, and what specific dates show the sharpest upward trends?
Topic Wins: Group their performance by topic. Which 3 specific tracked topics gave them their biggest visibility wins and highest share of voice?
Domain Authority: Analyze their domain retrieval data. Is their core domain being cited and retrieved by LLMs more heavily over time?
Influential Sources: Identify the top 5 third-party reference domains or common sources driving their visibility. Provide the citation rates, retrieval numbers, and status statistics for these top URLs.
Also, show a chart that shows correlation of % of top 10 sources mentioning their website, and their visibility, number of retrievals for their own website. Focus on their website and their brand only.
Format the final output into clear, data-backed sections matching these four points. Do not provide generic marketing advice; rely strictly on the calculated metrics pulled from the reports.
Prompt 4: Connect data from GSC and AI visibility tool
So far we've looked at Google search and AI visibility separately. Here's where the two start working together.
You're probably ranking for topics in Google that you haven't thought to track in AI search yet, or tracking prompts in Peec AI that barely register as real search demand. This prompt pulls the topics driving your Google traffic, checks them against the prompts you already track in Peec AI, and tells you where the mismatch is.
Using data from the BigQuery and Peec AI MCPs, provide me a comprehensive report on topical gaps:
Step 1: GSC topics (BigQuery MCP). Using searchdata_site_impression in [name of your table in Google BigQuery], pull the non-branded queries (exclude brand terms and misspelling variants) and group them into intent-based topics. For each topic show distinct query count, impressions, and clicks, ranked by impressions. Use SQL aggregation. State the date range.
Step 2: Use data from Peec AI MCP. Find the [name of your project] project, list its topics, and pull all tracked prompts. Report how many prompts fall under each topic, and separately count how many prompt texts touch each of the same intent themes used in Step 1 (keyword match), so the two sides are directly comparable.
Step 3: Reconcile and find gaps. Map the GSC topics onto the Peec AI themes (they use different taxonomies, so align them explicitly). Produce a table of GSC topics → search demand (impressions) → number of tracked prompts, and flag where high GSC demand meets zero or near-zero prompt coverage. Also note the inverse: themes heavily over-tracked relative to search demand.
Note in the output that GSC impressions measure Google search demand while Peec AI prompts measure LLM answer-engine visibility (overlapping but not identical audiences) so treat demand as a signal of interest, not a 1:1 target. End with the 2–3 highest-priority gaps worth filling.
Getting SEO data via Screaming Frog MCP
Everything up to here has been about search demand and visibility: what people search for, and whether you show up. Screaming Frog answers a different question: is your own site technically healthy enough to be found in the first place?
If you've done technical SEO for any length of time, you already know Screaming Frog. The SEO Spider has been one of the most popular desktop crawlers for over a decade, and a tool most of us reach for when auditing a site.
In May 2026, with version 24.0, it added a native MCP server. That lets Claude, Cursor, LM Studio, and other AI clients drive the crawler in plain English. You ask for a crawl, Claude tells the Spider to run it, then simply reads the results back to you.
Screaming Frog’s setup guide for connecting the MCP to Claude is here. I set it up on my local computer with Claude's help.
Once Screaming Frog is connected, you can run a crawl and ask questions about the results in plain language.
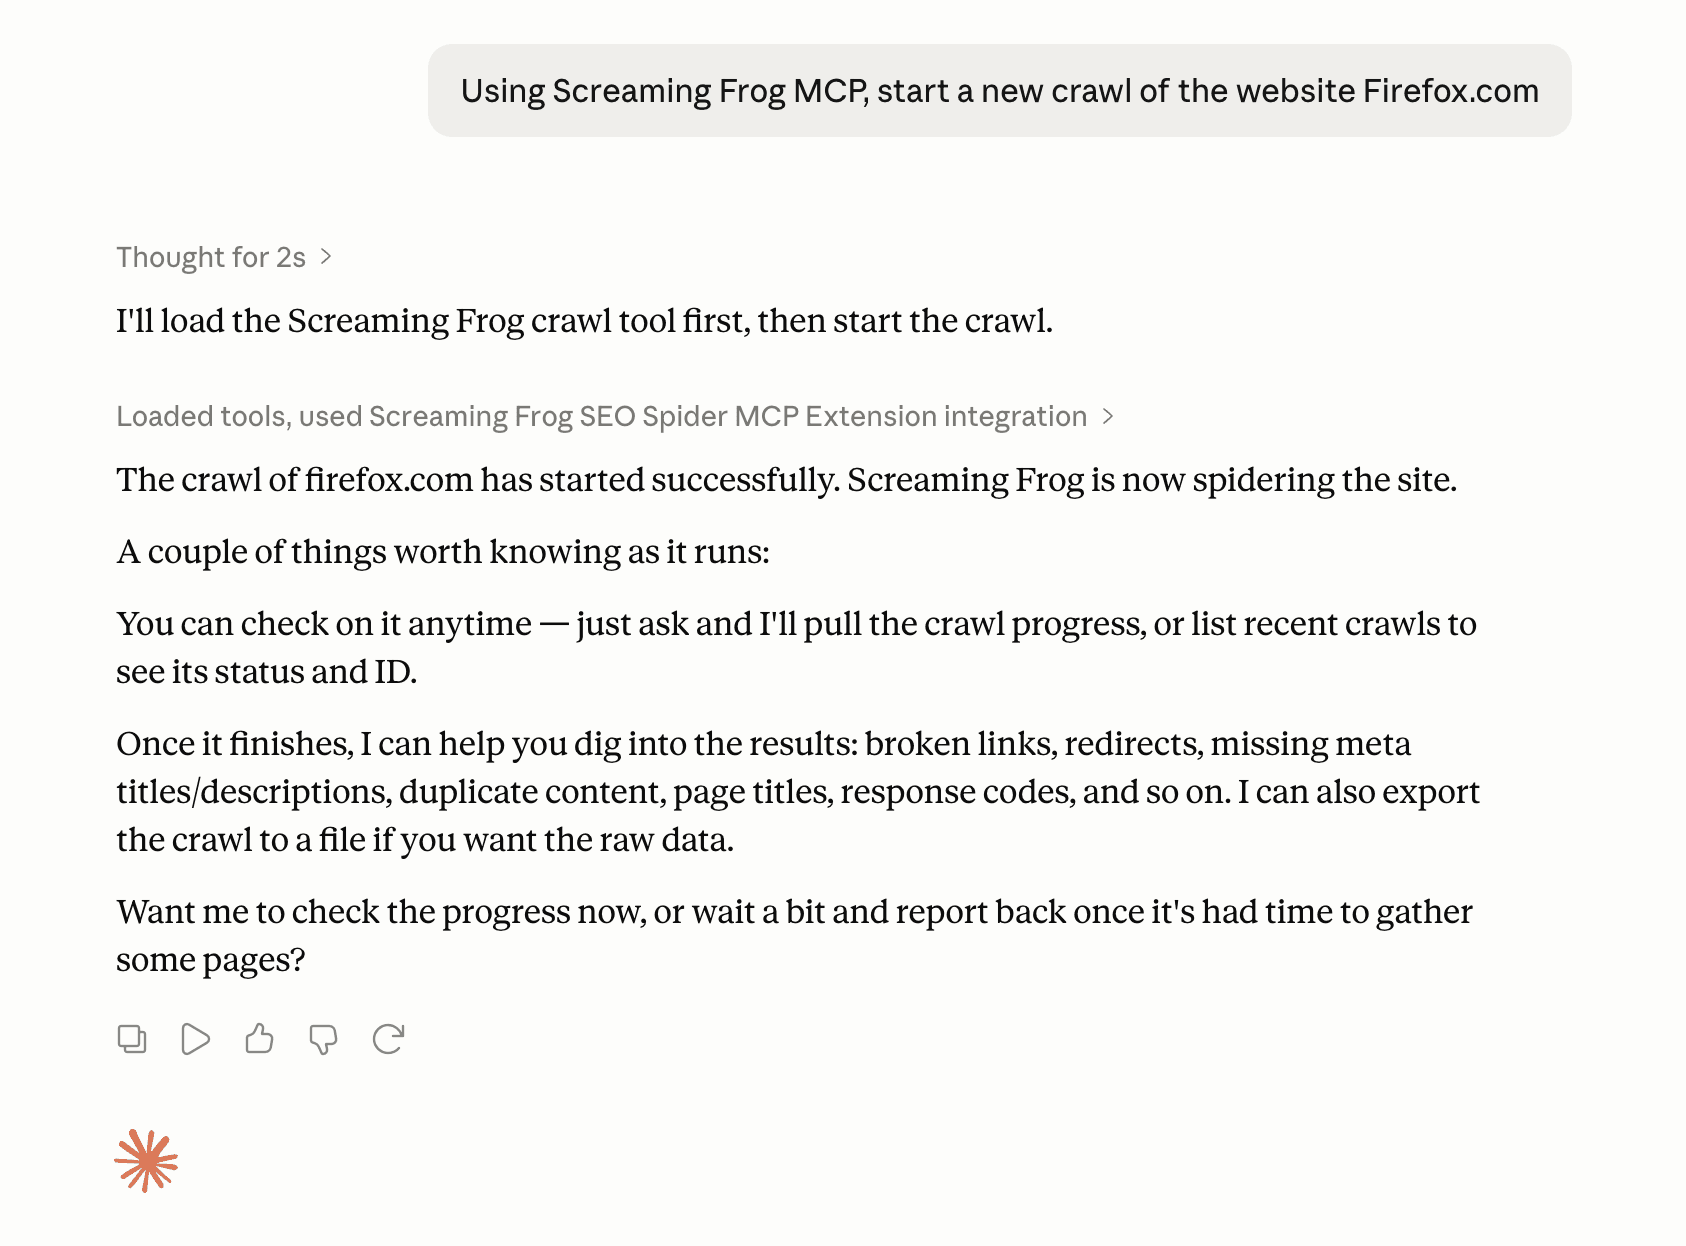
Start with the crawl itself. Use this prompt: Using Screaming Frog MCP, start a new crawl of the website [name of the website]
Then ask the questions you'd normally hunt for across half a dozen tabs and filters:
Indexability and waste
Show me top URLs that are noindex but have a high link score.
Show me important URLs (by inlinks) that are redirected.
Show me URLs that return 404 but have a high link score.
Summarize page groups that appear in sitemaps but have few internal links.
Templating and content issues
List URLs with duplicated titles.
Show pages where Title equals H1 (lazy templating).
Show important pages with the highest spelling and grammar error counts.
Rendering and parity
Show pages where the rendered HTML differs significantly from the raw HTML.
Find pages where the mobile and desktop versions differ significantly.
Trend over time
Compare this crawl to last month's - what are the biggest differences?
That last one is where it gets genuinely useful. Instead of comparing two exports by hand, you just ask what changed.
Experts’ workflows and takes on MCP
Everything above is how I work. But I wanted to know whether this held up beyond my own setup, so I asked a few people who use MCP differently than I do and at different scales. Their answers sharpened how I think about it, and each one points at something the guide above only hints at.
Zach Chahalis, Sr. Director of SEO and Data Analytics at iPullRank, zeroed in on what MCP actually changes. The point isn't that it unlocks data you couldn't reach before. It's that it lowers the technical barrier - so connecting data sources and building sophisticated systems is no longer just for advanced engineers.
"The reason MCPs are compelling for SEO and Relevance Engineering is that they make previously difficult data workflows more accessible.
A lot of the data SEOs need has historically been locked behind platform interfaces, APIs, or engineering-heavy integrations. Technical SEOs and engineers have been building these workflows for years, but MCPs lower the barrier for more people to participate in that kind of analysis.
That matters. When an SEO can connect prompt tracking data from Peec AI, crawl data from Screaming Frog, analytics data, and their own custom Python workflows, they can move past isolated reports and start building more sophisticated systems for AI visibility, custom AI metrics, performance, and relevance engineering.
For teams, this creates leverage and more time to focus on deeper strategy. For clients, it creates better work: cleaner analysis, stronger strategy, more efficient delivery, and insights that are easier to understand and act on."
Jan-Willem Bobbink, enterprise SEO consultant uses MCP from both sides: as a builder and a consumer.
"I build MCP servers that expose Google Search Console data and I use other people's MCP servers (Google Developer Knowledge, PostHog, PlayWright, Peec AI, and others) as a consumer every day. What makes it genuinely useful is that it removes the export-clean-pivot loop that eats most of an SEO's time and I can develop client specific dashboard and analysis tools setups really easily.
Because the MCPs are developed by experts with specific knowledge, output is way more consistent and trustworthy. Before MCP, answering a question like 'show me pages where impressions are up but clicks are down over the last 28 days' meant pulling data, loading it somewhere and building a pivot.
Now I ask the question in natural language and the model queries the source directly and reasons over the result. The data never leaves its warehouse, so there's no stale CSV floating around.
The part people underestimate is the engineering behind a good MCP server. A thin wrapper over an API works for a simple demo, but at real data volumes you need the heavy lifting (a proper analytical store, sensible defaults for date ranges, auth that an AI client can actually negotiate) done server-side. That way it becomes the fastest and most trustful way to interrogate your own data. That's the shift I am currently seeing: the tool you query and the assistant you talk to are finally the same surface.
For me, the next step will be testing agents to run autonomously and picking the right MCPs to get specific jobs done. For now, I have found ways to trust MCPs output, next is scaling my workflows."
Eoghan Henn, Search & AI strategist, goes one layer deeper, into reliability. Connecting an MCP is easy; getting consistent, dependable output from it is the part most people skip.
"Whenever I connect a new MCP, I immediately dedicate a session to exploring and stress-testing it. The result is a companion skill for the MCP that captures all the issues, inconsistencies and surprises the test surface, so every later run is more predictable and efficient. This pays off most in repeatable workflows, where the companion skill produces stable results and avoids token waste. I also run a system that monitors every skill in use and logs improvement opportunities, which get applied regularly, so each re-run of the MCP further increases the value of the companion skill."
What if there is no MCP?
Plenty of tools don't have an MCP yet, but that does not mean their data is off-limits. You've got a couple of options.
The tool has an API
Point Claude Code at the docs and let it do the plumbing:
Here's the API documentation: [paste the link]. Please write me a Python script that sends a request to this API and does [the thing you want].
You describe what you want in plain language; Claude Code writes the code that talks to the API.
The tool only exports CSV
Just hand the file to Claude Code and ask it to analyze the CSV file. If the file is too big to work with directly, you can upload the CSV into BigQuery and query it through the official BigQuery MCP, using the same setup from earlier in this guide. Or ask Claude Code to write a small Python script that opens the file and pulls out only the parts you care about.
Either way, not having an MCP isn't a dead end. An API or even a plain CSV export is usually enough to get you back to asking questions in plain language.
How to get started
Instead of trying to connect all three ecosystems at once, pick the one area where you currently spend the most manual effort:
If search data is your priority: Set up the Google BigQuery MCP and run the query intent analysis.
If you need to show AI visibility results: Connect the Peec AI MCP and build your first engine scorecard.
If you are doing a site audit: Update to Screaming Frog v24.0+ and run a crawl by asking Claude in plain English.
Get a feel for the back-and-forth conversation first. Once you're used to asking follow-up questions without touching a spreadsheet, it's hard to go back.
A final note
MCP isn't just a handy shortcut, and it won't replace your strategic instincts, set your business goals, or build your long-term plan. But it does change how we work as search marketers.
What it does is remove the friction and the tedious manual work: the endless CSV exports, the fragile VLOOKUPs, and the constant tab-switching.
For me, this has been a game-changer. I can now pull together data that used to be scattered across many sources and a nightmare to gather, then feed it into one smooth, automated process. Even better, it has opened up deep, multi-layered analyses I couldn't justify before, simply because they took too much time.
The search industry is changing too fast to spend your days wrestling with spreadsheets. Now you can connect your tools, start asking questions in plain language, and let the machines do the data gathering while you do the thinking and planning to improve your AI search visibility.


